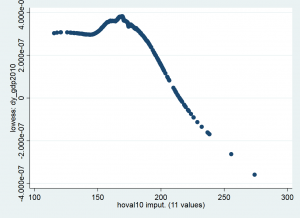
This ado file creates plots after estimating a model using Kernel-regularized least squares (KRLS). You need to obtain the KRLS ado package separately from this. This ado file creates various Lowess plots by regressing the estimated derivatives on the variables in the model. This was demonstrated and described in this published article:
This krlsplot.ado package determines which variable(s) are most strongly associated with a set of derivatives by regressing the derivatives on the variable and its squared and cubed versions. The user defines a cutoff r-square value for retaining a particular plot.
You can download the ado file, the example do file and dataset, and the documentation here. They are in a zipped file. Or you can download the krlsplot.ado file directly.
See the KRLSplots_documentation.pdf file for instructions on how to use.
Here is what an example plot looks like.
Contents:
krlsplots.ado – basic ado file to create variables aggregated to egohoods
example_code.do – do file to run example code to create plots after estimating a KRLS model.
msa_imp.dta – example dataset
KRLSplots_documentation.pdf – documentation file
