• Log In
  • Skip to content
  • Skip to primary sidebar

(ILSSC)

Irvine Lab for the Study of Space and Crime

  • Home
  • Welcome
  • Who We Are
    • Faculty
    • Graduate Students
    • Laboratory Alumni
  • Research
    • Current Research
    • “People and Places in Context” Symposium
  • Publications
    • Publications
    • Publications CV
  • Crime Report
    • Highlights from the 2019 Crime Report
    • Download the 2019 Crime Report
    • Predicted Crime Rates App
    • Past Years
  • SoCal Crime Study
  • Tools
    • Software
    • Egohoods
    • Latent Class Analysis Fix
    • Technical Reports
    • Geocoding Crime
    • Synthetic Estimation
    • Apps
    • Predicted Crime Rates Application
    • Southern California Crime Map
  • Opportunities
    • Postdoctoral Opportunities
    • Graduate Opportunities
    • Undergrad Opportunities
  • News
    • News
    • News to 2017

Software

KRLSplots ado package for Stata

June 6, 2020 by hippj

This ado file creates plots after estimating a model using Kernel-regularized least squares (KRLS).  You need to obtain the KRLS ado package separately from this. This ado file creates various Lowess plots by regressing the estimated derivatives on the variables in the model.  This was demonstrated and described in this published article:

Hipp, John R., Kevin Kane, and Jae Hong Kim. (2017). “Recipes for Neighborhood Development: A Machine Learning Approach toward Understanding the Impact of Mixing in Neighborhoods.” Landscape and Urban Planning.  164: 1-12.

This krlsplot.ado package determines which variable(s) are most strongly associated with a set of derivatives by regressing the derivatives on the variable and its squared and cubed versions.  The user defines a cutoff r-square value for retaining a particular plot. 

You can download the ado file, the example do file and dataset, and the documentation here.  They are in a zipped file.  Or you can download the krlsplot.ado file directly.

See the KRLSplots_documentation.pdf file for instructions on how to use.

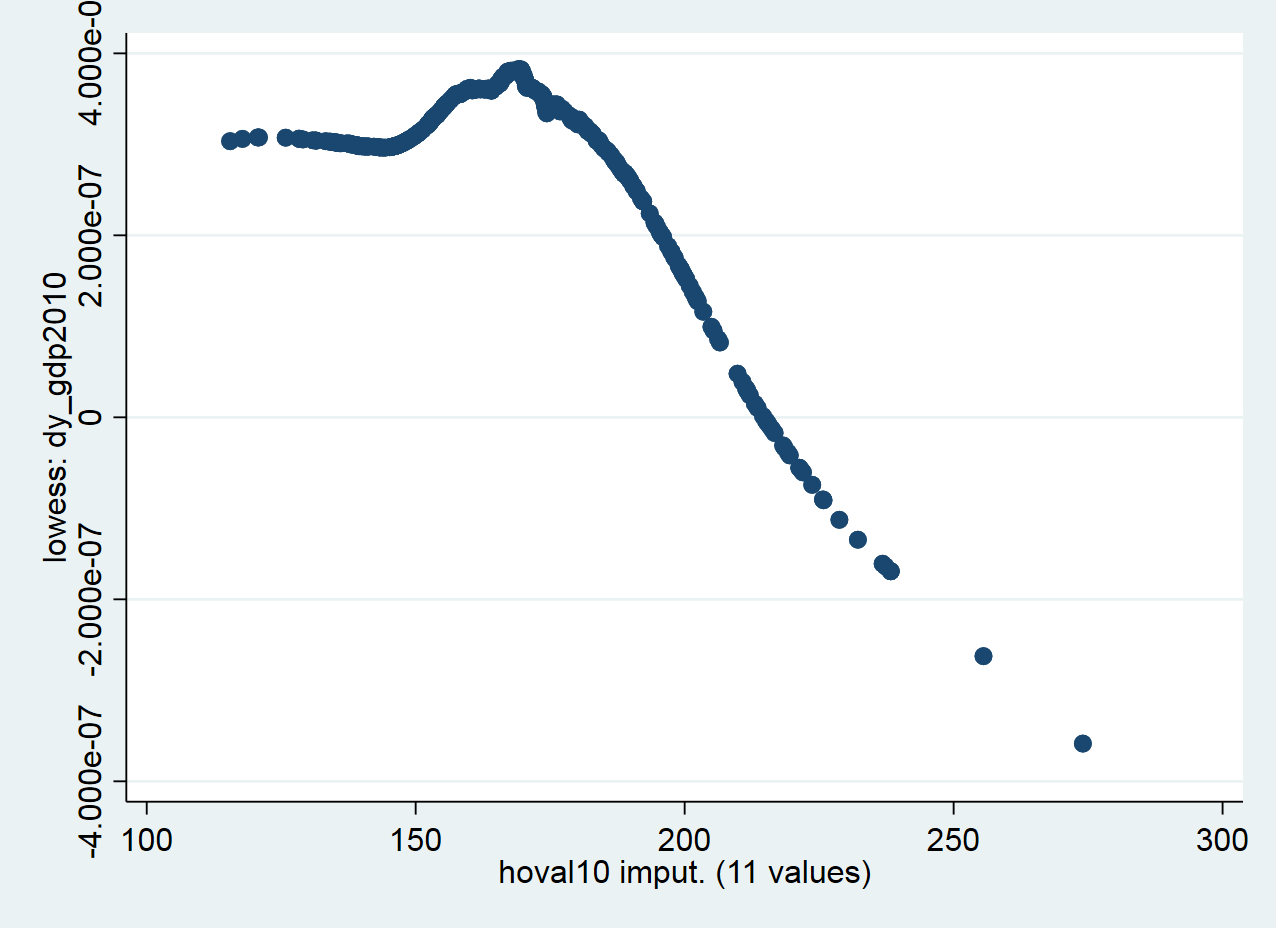
Here is what an example plot looks like.

Contents:

krlsplots.ado – basic ado file to create variables aggregated to egohoods

example_code.do – do file to run example code to create plots after estimating a KRLS model.

msa_imp.dta – example dataset

KRLSplots_documentation.pdf – documentation file


Filed Under: krlsplots, Software

Egohoods Package for Stata

February 10, 2017 by batesc

These ado files allow the researcher to take data aggregated to other units and aggregate them to egohoods.  Note that it is preferable to have the original data contained in small units such as blocks—this allows for the smoothest construction of egohoods.  If the data are in larger units, there will be an additional level of measurement error introduced to the egohoods measures.  This is not fatal—it just implies some more error.  Nearly all measures in social science research contain measurement error, and the prudent researcher might consider an analytic technique that explicitly accounts for this (e.g., structural equation modeling).

[Read more…] about Egohoods Package for Stata

Filed Under: Egohoods, Software

Primary Sidebar

© 2025 UC Regents